
360° walkthroughs are now routine on construction sites, captured regularly for documentation and coordination. But in many teams, these scans stop short of their full potential.
Without structured analysis, walkthroughs often stay siloed. Progress tracking still involves site visits, photos, and manual updates. And valuable data remains untapped.
The question is: why should something as smart as a 360° capture end in a manual workflow?
From walkthrough to report, in hours, not days
That’s exactly what Preimage solves.
With Preimage, your standard site walkthrough becomes the starting point for a powerful, automated reporting engine. From a single 360° video or drone scan, you can generate detailed, visual reports that help teams:
- Track weekly or milestone-based progress
- Flag visible defects
- Detect site changes or deviations
- Understand installed systems via segmentation
And the best part? It takes just 2–3 hours to turn your footage into a complete report, ready to review, share, and act on.
What types of reports can you generate?
Preimage currently supports four major categories of site reports, each one designed to eliminate ambiguity and speed up coordination.
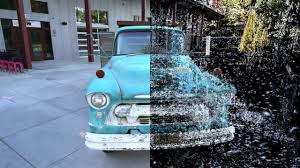
1. Visual Progress Reports
Track installation and construction status across rooms, floors, or trades
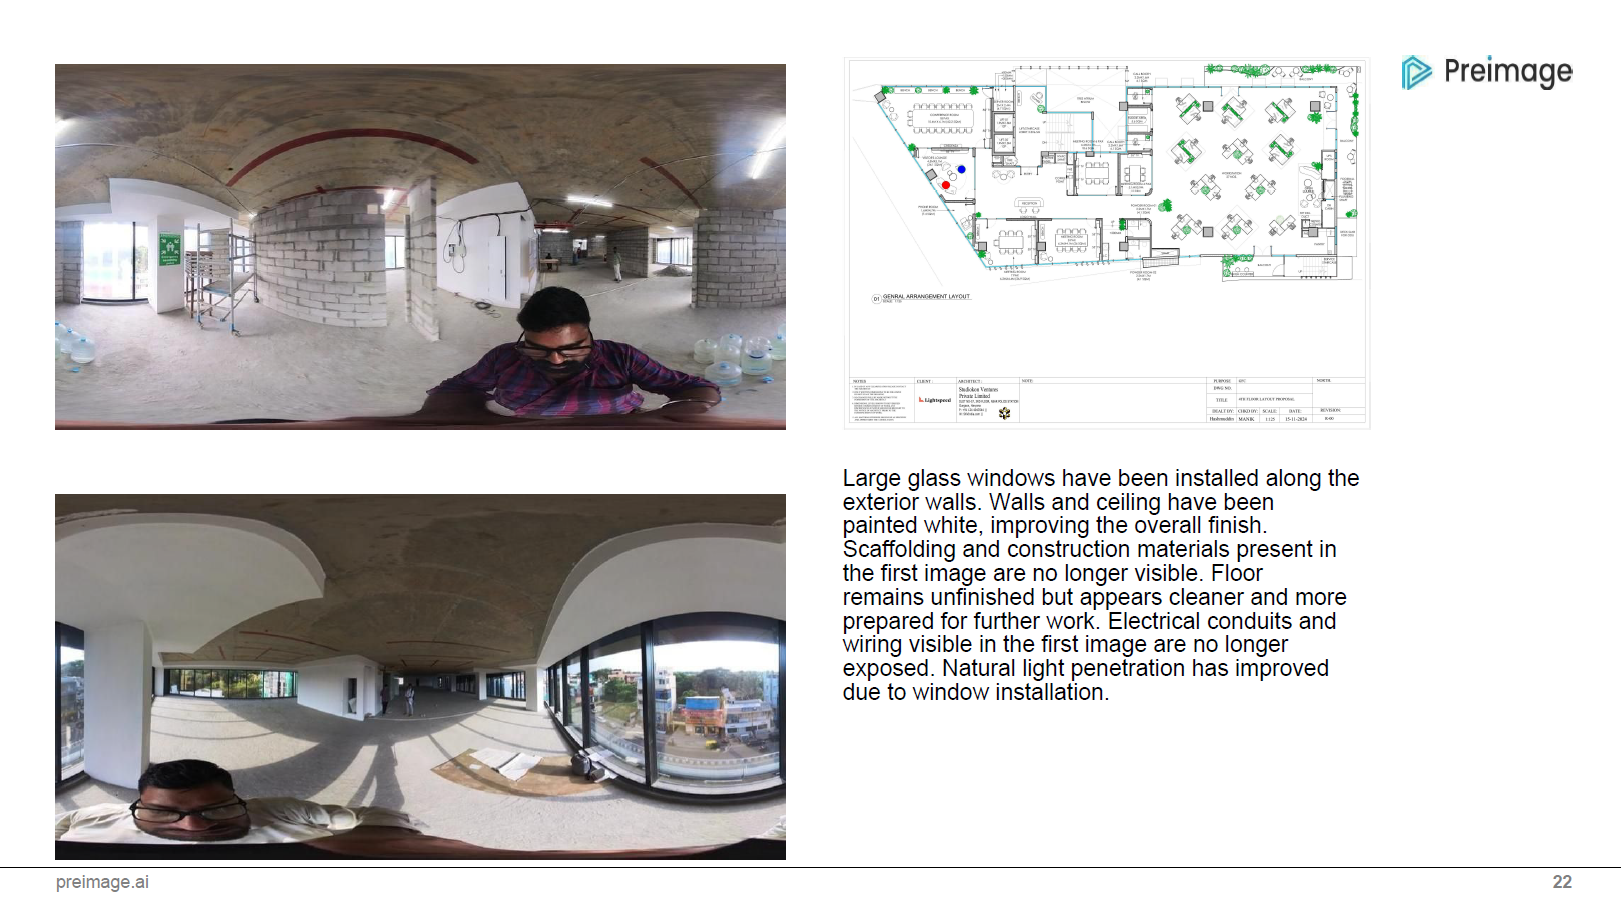
Preimage compares your current and past walkthroughs to help you understand how your site is evolving.
With side-by-side comparisons, you can:
- Visually identify what’s changed between captures
- Spot progress in finishes, MEP, and structural elements
- Export snapshots that highlight key differences
This helps teams verify progress remotely, catch delays early, and coordinate effectively across contractors, all without manual tagging or repeated site visits.
2. Defect Detection Reports
Automatically identify and flag visible issues across your site
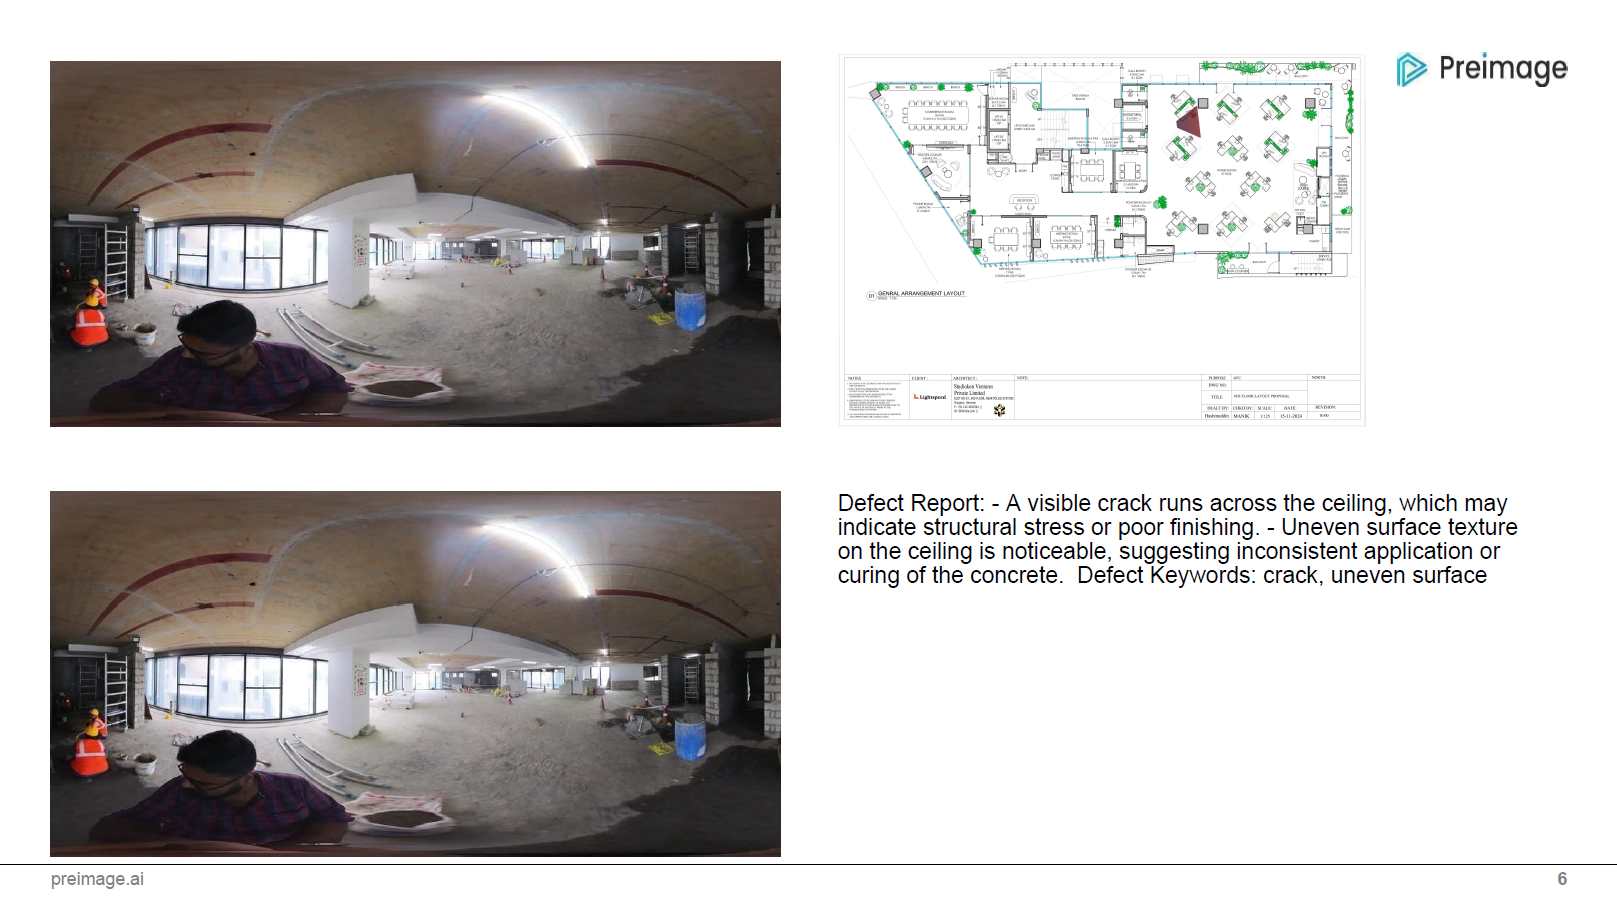
From cracked finishes to missing skirtings, Preimage’s AI analyzes your walkthrough and flags potential quality issues, frame by frame.
Each detected issue is documented with:
- Location context
- Visual evidence
- Category or tag (where applicable)
This allows teams to inspect defects, assign follow-ups, and track resolution over time, making it ideal for quality checks and handover preparation.
3. Segmentation Reports
Understand what building elements are present, and where
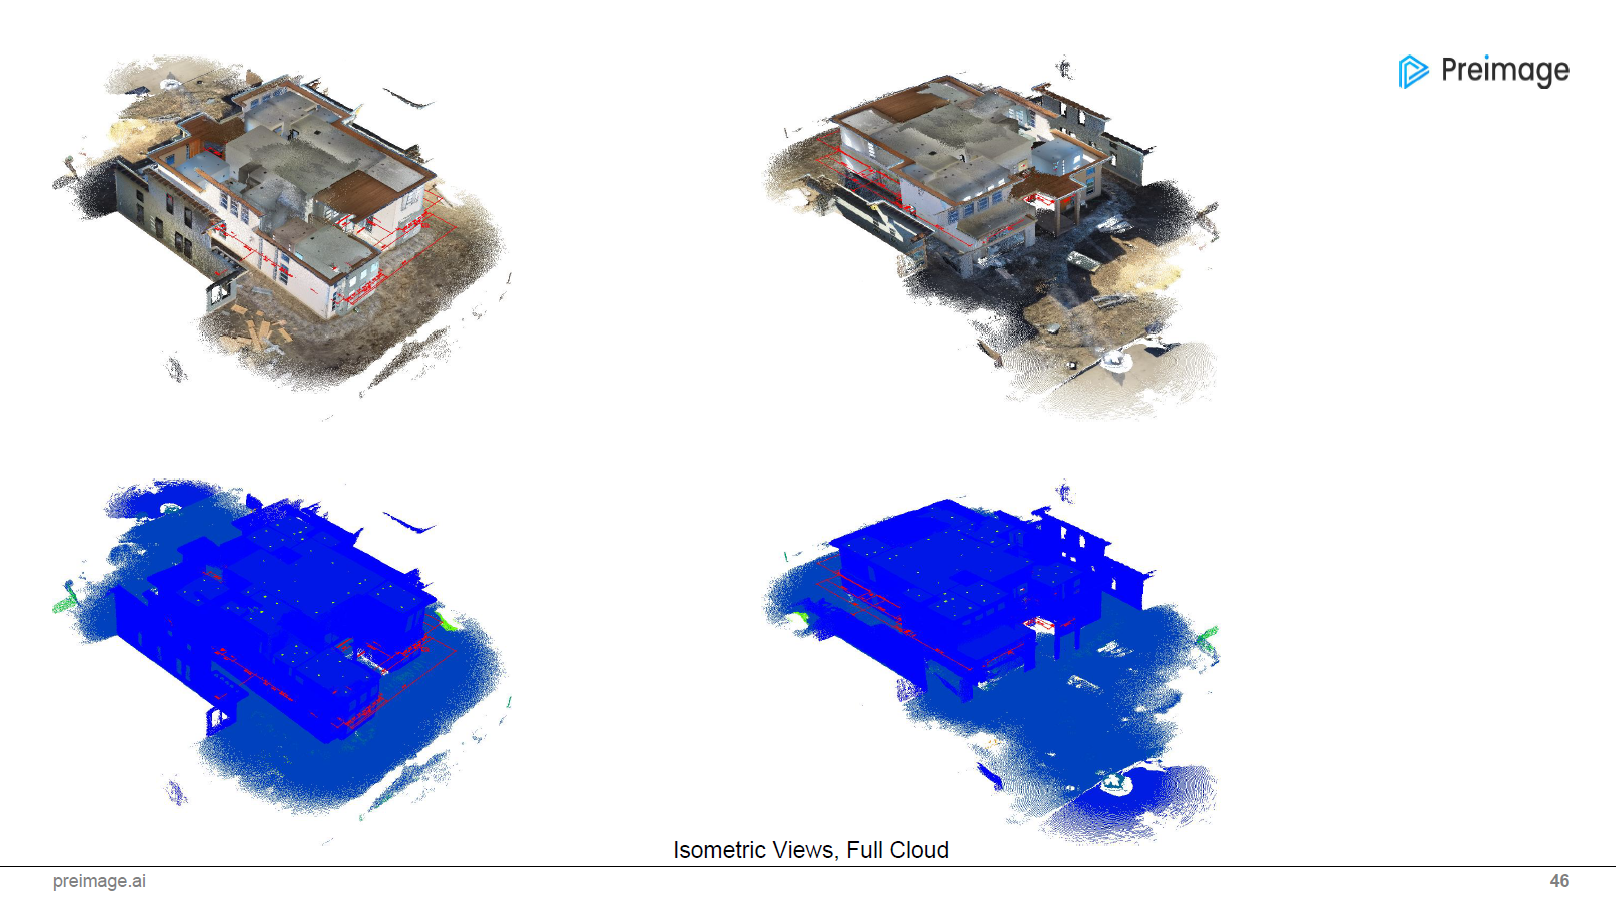
Preimage segments your site scan into labeled categories: structural, architectural, and MEP elements like walls, doors, ducts, beams, and more. This output forms the foundation for:
- BIM modeling
- Quantity takeoffs
- Room-wise element tracking
It’s not just visual, it’s structured data you can build workflows on.
4. Deviation Reports
Compare two scans or a scan vs BIM model to detect mismatches
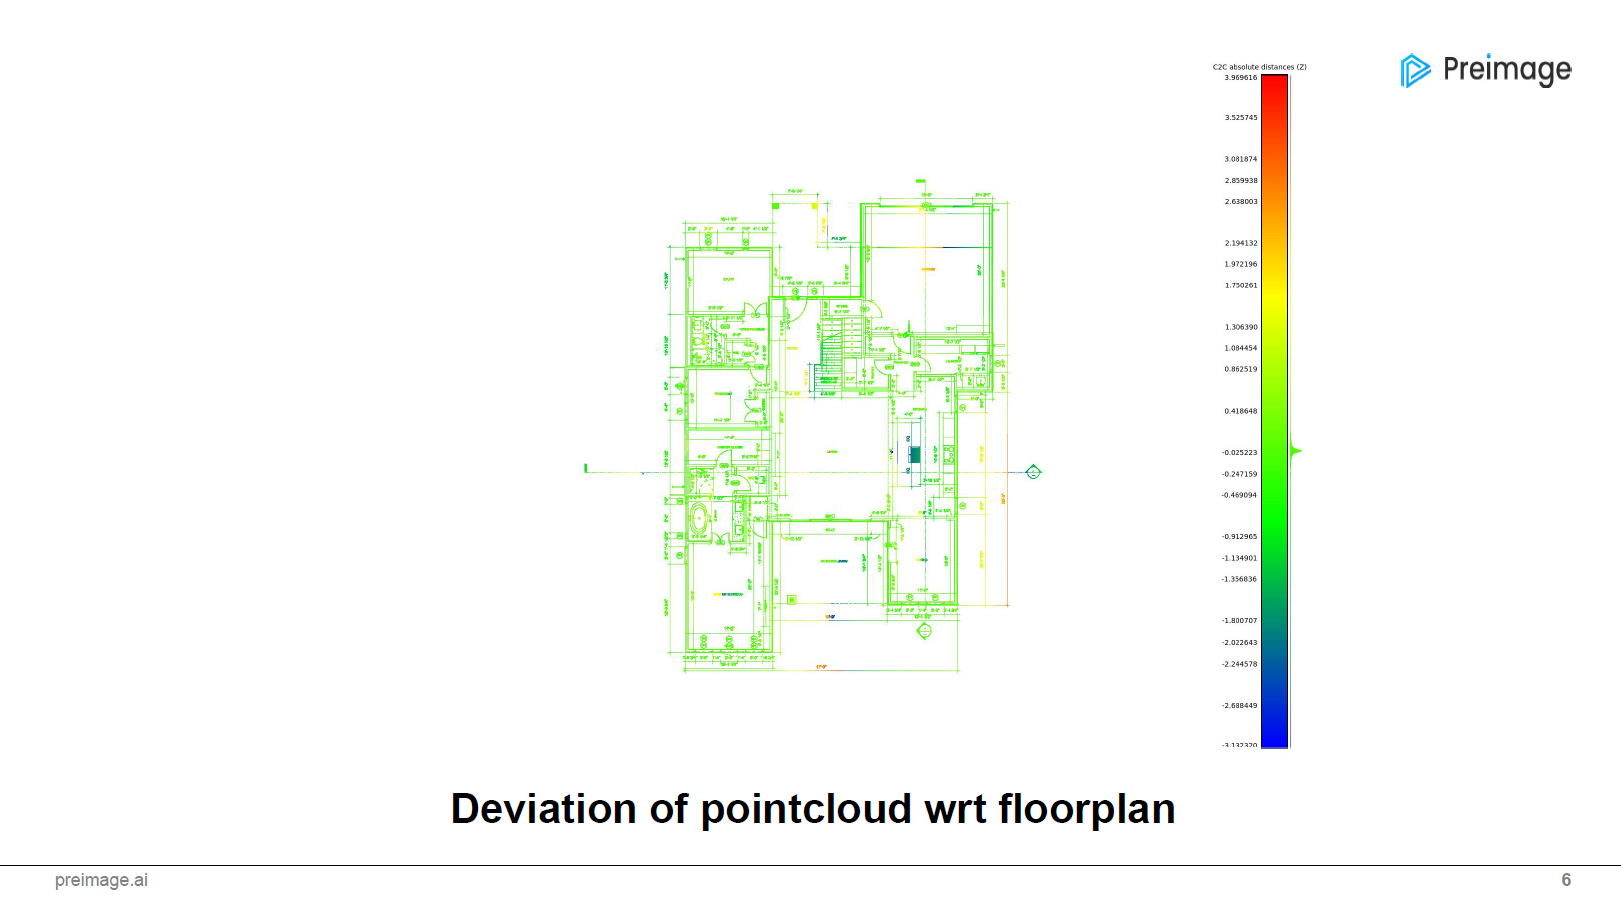
Preimage makes it easy to identify changes, misalignments, or delays by comparing:
- Scan-to-scan: Understand what’s changed between two walkthroughs, useful for weekly site tracking or validating work done before billing.
- Scan vs. BIM: Detect deviations between the as-built reality and the design model, especially useful during execution and QA phases.
Deviation reports helps to catch errors early, validate installation sequences, and reduce back-and-forth between site and office.
Stay on top of it all with the Analytics Dashboard
While reports give you detailed insights per scan, the Preimage Analytics Dashboard gives you the bigger picture.
It pulls data across scans and projects into one unified view, so you can:
- Track progress across time, floors, or trades
- Visualize site coverage and scanning frequency
- Monitor open issues and follow-ups
- Export summaries for internal reporting or client updates
Whether you’re managing a single site or an entire portfolio, the dashboard helps you stay informed, prioritize actions, and move faster, without sorting through folders or files.
Built for project speed, not complexity
Preimage is made for construction teams who want clarity without the overhead.
There’s no need to tag images, stitch panoramas, or process data manually. Just:
- Walk the site with a 360° camera
- Upload your scan to Preimage
- Select the reports you want
- Get structured insights in just a few hours
All outputs from interactive tours to reports and analytics are cloud hosted, easy to share, and accessible from anywhere.
Whether you are managing a single site or dozens, Preimage fits right into your workflow with no extra tools to learn and no delays to chase.
Ready to turn your site into insight?
360° walkthroughs already capture the full picture, Preimage transforms them into measurable reports with progress tracking, defect detection, comparisons, and more.
Try Preimage now and get structured insights from your next site walkthrough, in just a few hours.
Prefer a walkthrough first? Book a Demo and see it live across your own projects.


.webp)